

An Overview of Observability
Observability, in its broadest sense, is the ability to evaluate and understand the internal state of an application based on the data it produces. By creating applications and systems that produce such data (referred to as telemetry), developers can analyze and diagnose problems in their systems. The ultimate goal of making a system observable is to have “the ability to ask any question of your system…without having to predict that question, behavior, or experience in advance.”
In order for a system to be observable, it needs to produce telemetry data. Traditionally, that data takes the form of metrics, traces, and logs, often called the “three pillars of observability.” In recent years, profiles have increasingly become common as the fourth pillar.
Pillars of Observability
Section titled “Pillars of Observability”Metrics
Section titled “Metrics”Metrics are measurements of a service or system at runtime. A metric might capture the current CPU utilization, the amount of memory being used by an application, or the average latency of a service. Through metrics, developers are able to monitor the state of a system or an application and answer the question “Is something happening?”
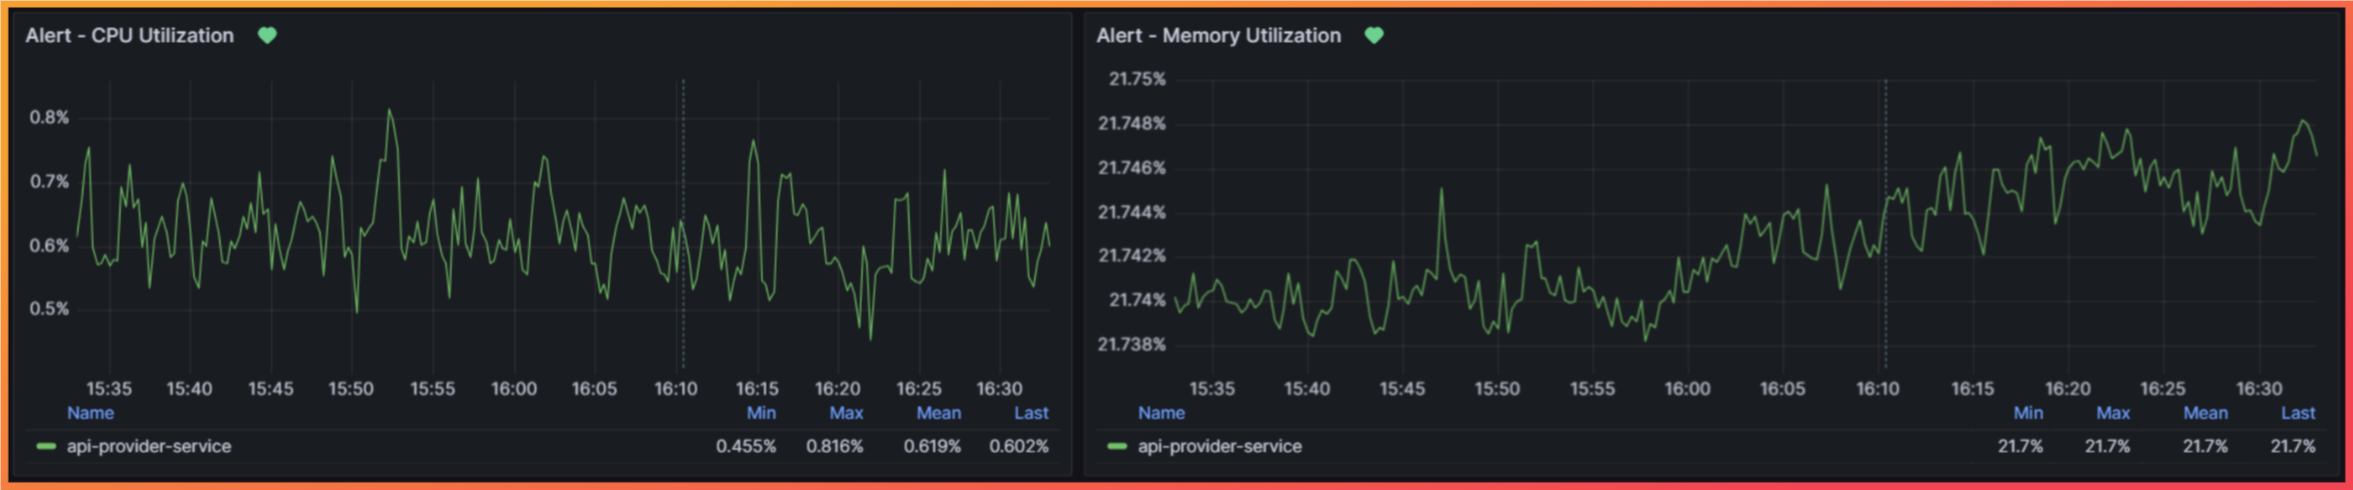
Two examples of system metrics
For instance, a common use case is to monitor what are known as “RED” metrics: rate, error, and duration metrics. These metrics are focused on the number of requests received per second (rate), the number of errors (error), and the duration of requests (duration). By collecting RED metrics and monitoring their change over time, developers are able to focus on outliers (referred to as P99 for 99th percentile) to improve the performance of an application or service. Moreover, metrics can be used to configure alerts that notify developers when predefined thresholds are exceeded, indicating that an issue needs to be investigated and resolved.
The primary limitation of metrics is that it’s often difficult to diagnose what causes outliers or alerts within an application or system. For this, more detail is needed about the components of an application.
Traces
Section titled “Traces”Traces are a collection of events that record the path a request takes through a system and are used to understand how services in a system are related to each other. The events that make up a single trace are called spans. By recording spans that occur in a system (e.g., a POST request to an endpoint and a subsequent write to a database) and chaining them together as parent and child spans, traces allow developers to identify how the various services within an application interact for a single request. Additionally, it allows developers to pinpoint the service(s) that produce errors or introduce latency into a request.
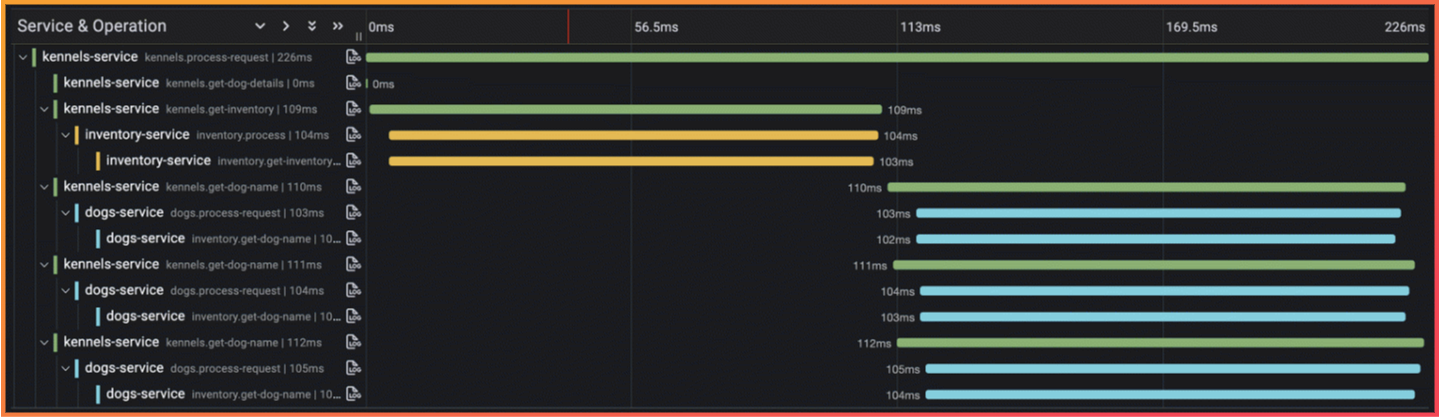
A trace waterfall showing multiple spans for a single trace
Traces are ultimately concerned with the bigger picture of how distinct services within an application or ecosystem behave together and are commonly used in microservice architectures. While this is a powerful tool for observing a system, a key limitation is that traces provide very limited insight into the internals of a service.
Logs should be familiar to most programmers as they are the oldest form of telemetry, predating the modern concept of observability. Logs are timestamped, text records capturing metadata or some form of message detailing what occurred in a system. The message could be as simple as a statement that a function has been executed, or more complex, like recording an error and providing some information about the state of the application for debugging purposes.
Logs have long been useful for looking back at a program to see what has occurred, as structured logs provide the level of granularity needed to understand what is happening within an application at a code level. However, the challenge is that searching logs to first find and then understand the cause of an issue is a laborious process.
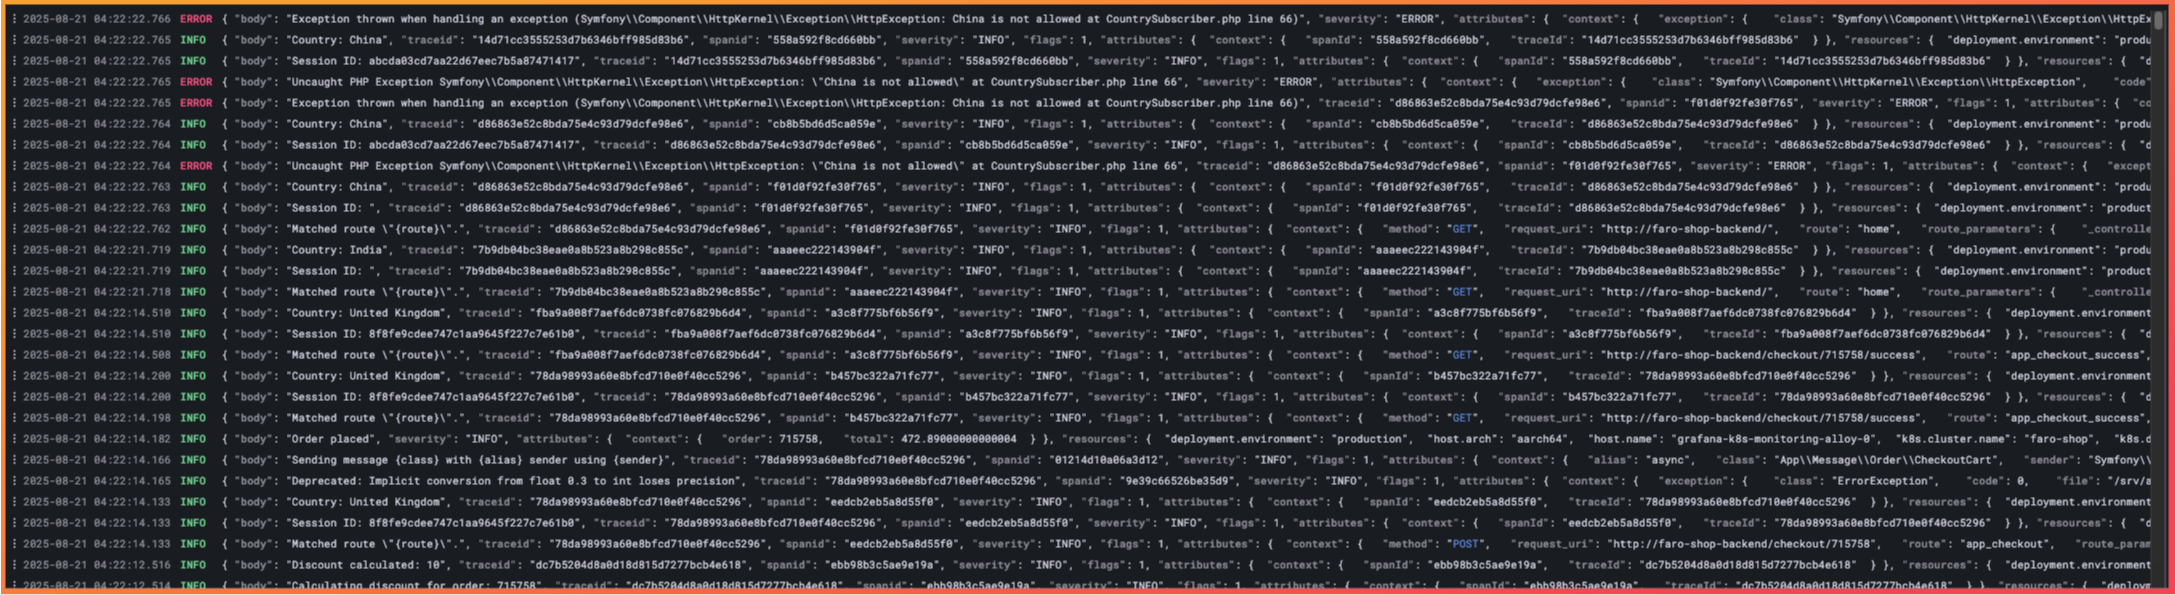
Output from logging, demonstrating the challenge of searching logs to perform a root cause analysis
Additionally, it relies on having existing logging at the right points within a codebase with enough detail to allow an effective root cause analysis. Often, when issues are found, logs only allow developers to approximate the source of the issues. Another significant drawback is the required storage and associated cost; logging can generate a significant amount of data that requires dedicated storage.
These limitations are often mitigated by combining logging with the other forms of telemetry to limit the scope of logs that need to be produced and then searched. Additionally, the expansion of continuous profiling has provided an additional source to investigate the internal state of the system.
Profiles
Section titled “Profiles”The “profiles” telemetry signal is produced through continuous profiling. Continuous profiling is a method to dynamically inspect the behavior and performance of application code at runtime and calculate the resource utilization of running functions. Profiles can tell you if a specific function in your application drives a significant percentage of the CPU, or which functions have higher memory allocations.
A profile is generated by collecting samples of system resource usage (e.g., CPU utilization, memory allocation, etc) by function, often hundreds of times per second. By aggregating these samples, a continuous profiler is able to produce a relative measure of resource utilization for each function call within a specific time period. Profiles are often analyzed through a flamegraph which visualizes the stack traces collected through the profiler and sizes particular function calls based on their relative utilization system resources.
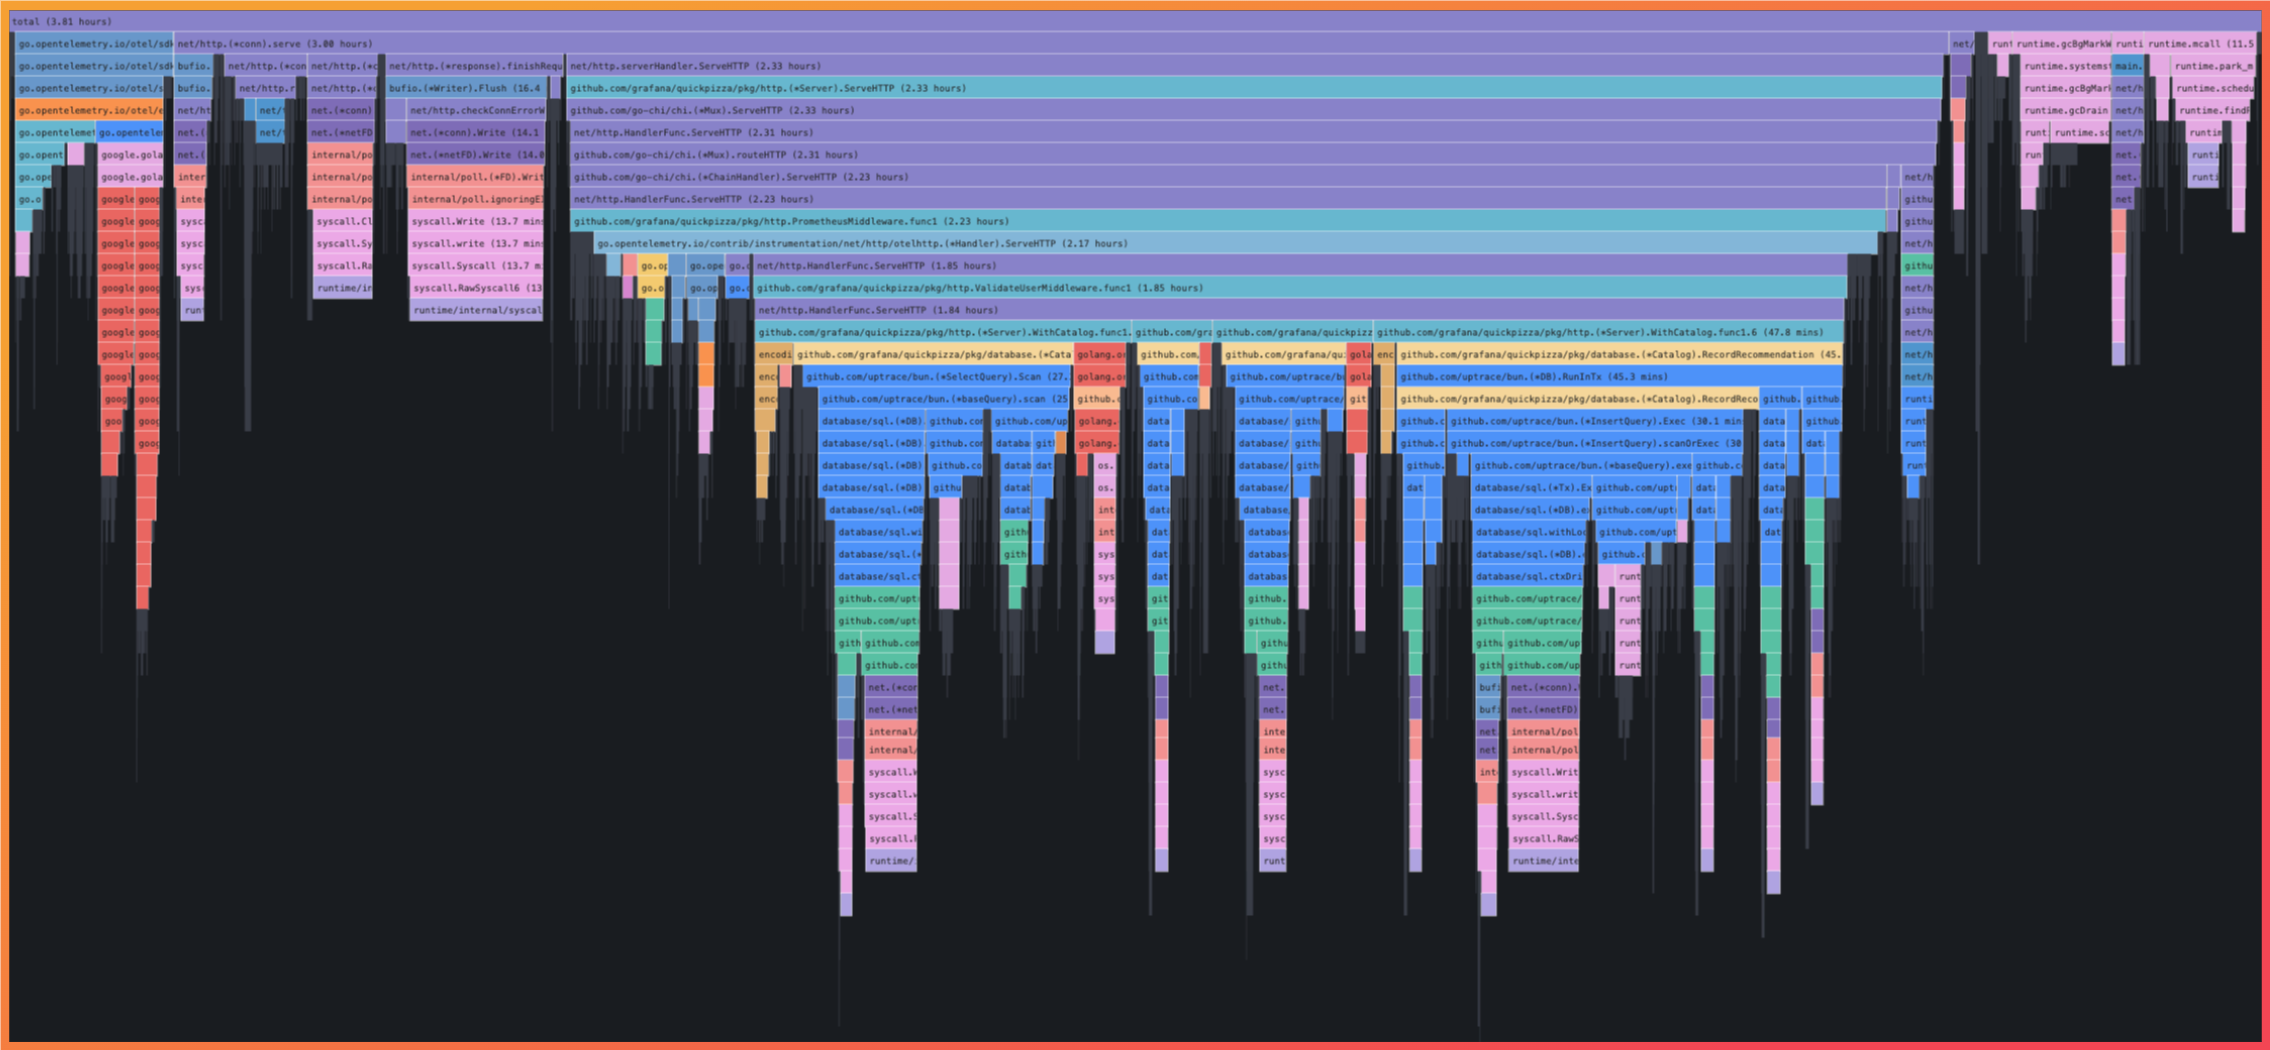
A flame graph showing the relative time the CPU spent on each function
This level of analysis alone is enough to identify code optimization opportunities that can eliminate latency issues or even improve performance without increasing infrastructure spend. Combining this detail with traces, metrics, and logs has become an increasingly common method to unlock even further insight into the internal state of an application.
As described above, with traditional observability data the depth of information typically stops at the system or “service” level, resulting in the need to manually investigate large volumes of logs or run debugging processes in development environments. By collecting profiles of code-level system behavior, developers can identify how specific portions of their code impact the performance of an application with comparatively less effort.
An Observability Platform
Section titled “An Observability Platform”Altogether, the four telemetry signals can give developers an in-depth view of a program’s performance. An observability platform surfaces insights from these signals through the following architectural layers:

The four components of an observability platform
Instrumentation
Section titled “Instrumentation”Instrumentation is the process of gathering runtime data about an application for one or more telemetry signals. This process often relies on language-specific SDKs which are added to a code base and executed as part of the program. In some cases, instrumentation may already exist in a code base as part of third-party libraries and packages that are preconfigured to work with observability tooling once implemented.
Language-specific SDKs are a common method of implementing instrumentation due to the ability to customize the information produced. However, this comes with the tradeoff of requiring additions to your code base to enable that information. As an alternative, an increasingly popular option for instrumenting applications is eBPF-based tooling.
eBPF (extended Berkley Packet Filter, though the acronym is now a standalone term) is a Linux-based technology that allows observability tooling to retrieve telemetry data from the kernel without the need to manually instrument an application. This is enabled through the core functionality of eBPF, which allows developers to run observability tooling in a sandboxed environment within a Linux kernel. The kernel then handles program verification to validate that it is safe to run. Because the program is just-in-time compiled, programs run as efficiently as natively compiled kernel code, resulting in minimal compute overhead.
The specifics of eBPF implementation and execution are beyond the scope of this case study, but it’s important to note that leveraging eBPF allows observability tools to directly gather information about stack traces, memory allocation, the OS networking layer, and trace spans related to web transactions. This is possible without adding any additional application code or configuration.
While eBPF is an increasingly popular option for instrumentation, it does come with tradeoffs: First, it requires a newer Linux kernel, which limits compatibility and portability of tooling. Though older versions generally support eBPF, the technology has rapidly evolved since its first release. Recent eBPF tools might require the latest kernel releases to take advantage of the newest features, which could require infrastructure modifications in order to deploy instrumentation. Second, it limits the customizability of observability data, as this would require application-specific additions to embed custom metadata or tags within telemetry data.
Telemetry Pipeline
Section titled “Telemetry Pipeline”A telemetry pipeline provides a means to collect, process, aggregate, and transmit data from instrumented applications to the rest of the observability platform. Because telemetry data usually comes in high frequencies and volumes, it’s common to leverage a pipeline to centralize and batch telemetry data, especially when the data is being generated by multiple services. This pipeline can utilize a “pull” method, where it scrapes telemetry data from an endpoint, or a “push” method, where it provides an endpoint for services to send telemetry data.

A telemetry pipeline connecting instrumented applications to data storage
The benefits of using a pipeline are compounded when working with multiple telemetry signals, as it provides a central endpoint for all data, regardless of signal or tooling. Of course, leveraging this benefit requires all tooling to conform to the same format. For this reason, the observability industry has coalesced around the OpenTelemetry Protocol (OTLP) as the industry standard for transmitting telemetry signals. We expand more on OpenTelemetry and OTLP in The Observability Landscape section below.
In addition to aggregation and standardization of telemetry data, leveraging a collector also provides the ability to batch data, limiting the amount of network requests and load placed on downstream endpoints in the pipeline. It also provides the ability to transform data before it arrives at its data storage location, allowing developers to augment or enrich telemetry metadata for later analysis.
The tradeoffs of implementing a collector are the increased complexity of adding another component to the observability stack and the need to manage scaling, as the collector can now become a single point of failure if not architected to ensure high availability.
Data Storage
Section titled “Data Storage”Storage for observability data is unique because of the bespoke nature of different telemetry signals and high volumes. This results in many data stores that are customized to the specific telemetry data being collected, as opposed to traditional forms of data storage like a relational database.

A telemetry pipeline connecting to four distinct data stores, one for each telemetry signal
Metrics are perhaps the best example: this signal produces high volume, high cardinality time series data, requires frequent writes, and needs efficient indexing for fast, frequent retrieval of data. As a result, the data stores for metrics are typically time-series databases (TSDB) built to work with the high-volume nature of metrics. The most common of these is Prometheus, which is discussed further in the The Observability Landscape section below. Other forms of telemetry require different forms of data storage (e.g., traces and logs are often written to object storage instead of a time-series or relational database).
The importance of the data store is also dependent on compatibility with the telemetry pipeline, the format of the data it receives, the availability of compatible instrumentation, and compatibility with frontend visualization tools. The tradeoffs of any particular data store are specific to the nature of the signal and prior choices made elsewhere in the architecture.
Visualization
Section titled “Visualization”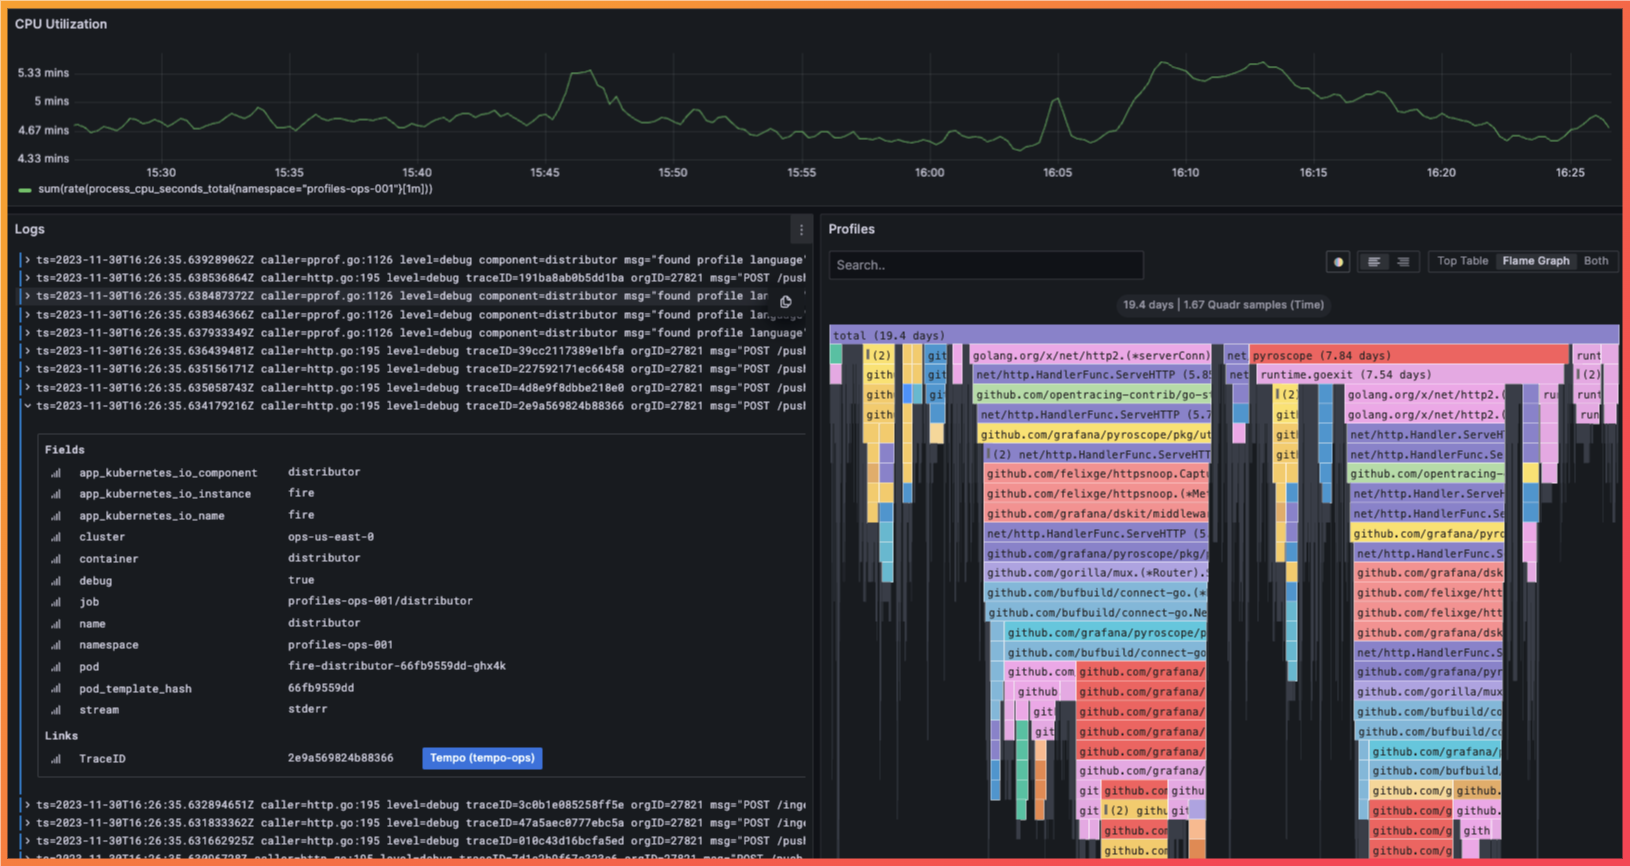
An interactive dashboard visualizing multiple telemetry signals
The last component of the platform is the visualization layer, which provides a dedicated user interface to interact with the data. Through the UI, a developer gains dashboarding, alerting, and querying capabilities. This all serves the benefit of giving developers the ability to take action based on the data collected. The choice of a visualization platform is driven by compatibility with chosen data sources and the provided features of the tool (e.g., querying, analysis, alerting, dashboarding, etc).